- About Us
- Farm Store
- Belle's Barber Shop
- Media
- Fuel Prices
- Cash Dividend History
- Location Map
- Contact Us
- Market Overview
- Futures
- Options
- Charts
- Custom Charts
- Spread Charts
- Market Heat Maps
- Historical Data
- Stocks
- Real-Time Markets
- Site Register
- Mobile Website
- Trading Calendar
- Futures 101
- Commodity Symbols
- Real-Time Quotes
- CME Hedging Resource Center
- Farmer's Almanac
- USDA Reports

American Airlines (AAL) : Buying The Stock at the Blue Box
Hello fellow traders,
As our members know we have had many profitable trading setups recently. In this technical article, we are going to present another Elliott Wave trading setup we got in American Airlines (AAL) . The stock completed correction precisely at the Equal Legs zone, referred to as the Blue Box Area. In the following sections, we will delve into the specifics of the Elliott Wave pattern observed and discuss the corresponding trading setup in detail.
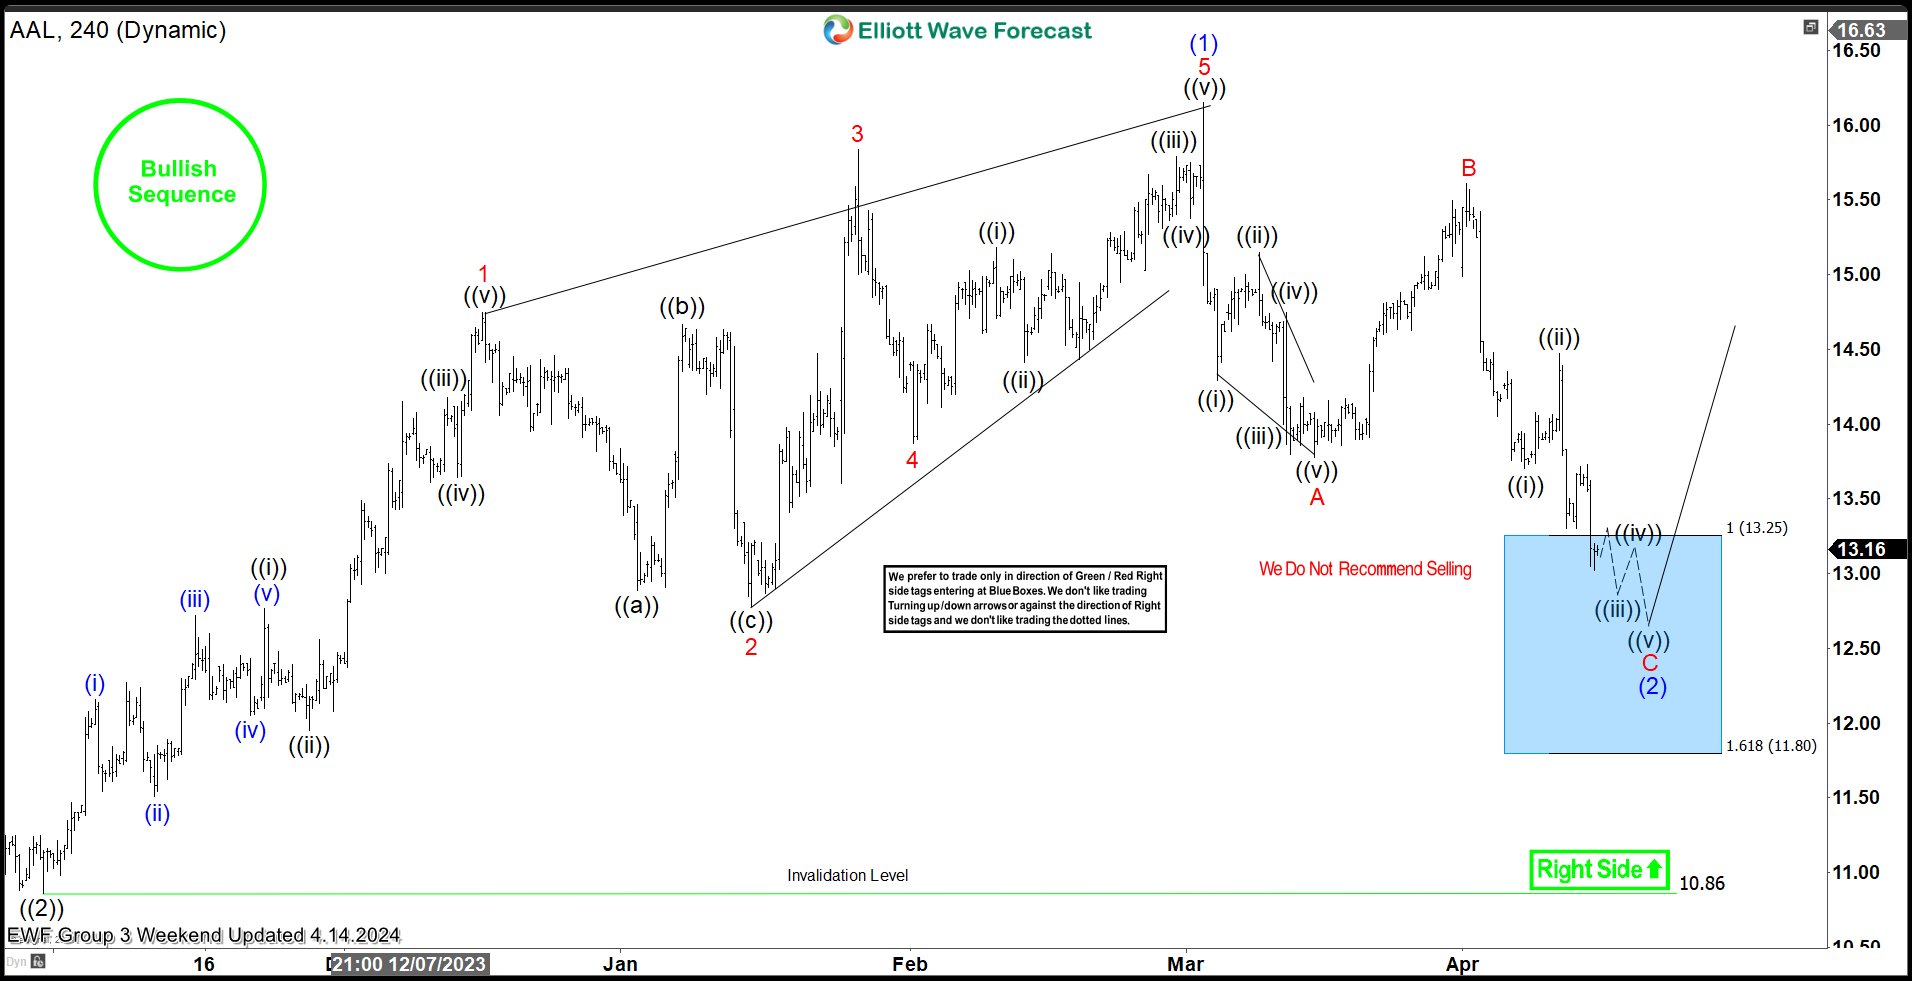
AAL Elliott Wave 4 Hour Asia Chart 04.14.2024
Current view suggests AAL stock is doing wave (2) blue correction. The price has reached extreme zone at 13.25-11.8 (blue box- buying area).
We’re entering long positions within the Blue Box. As the main trend remains bullish, we anticipate at least a 3-wave bounce from this area. Once the price touches the 50 fibs against the B red connector, we’ll make positions risk-free and set the stop loss at breakeven and book partial profits. Breaking below the 1.618 Fibonacci extension level at 11.8 would invalidate the trade.
Official trading strategy on How to trade 3, 7, or 11 swing and equal leg is explained in details in Educational Video, available for members viewing inside the membership area.
Quick reminder on how to trade our charts :
Red bearish stamp+ blue box = Selling Setup
Green bullish stamp+ blue box = Buying Setup
Charts with Black stamps are not tradable. 🚫
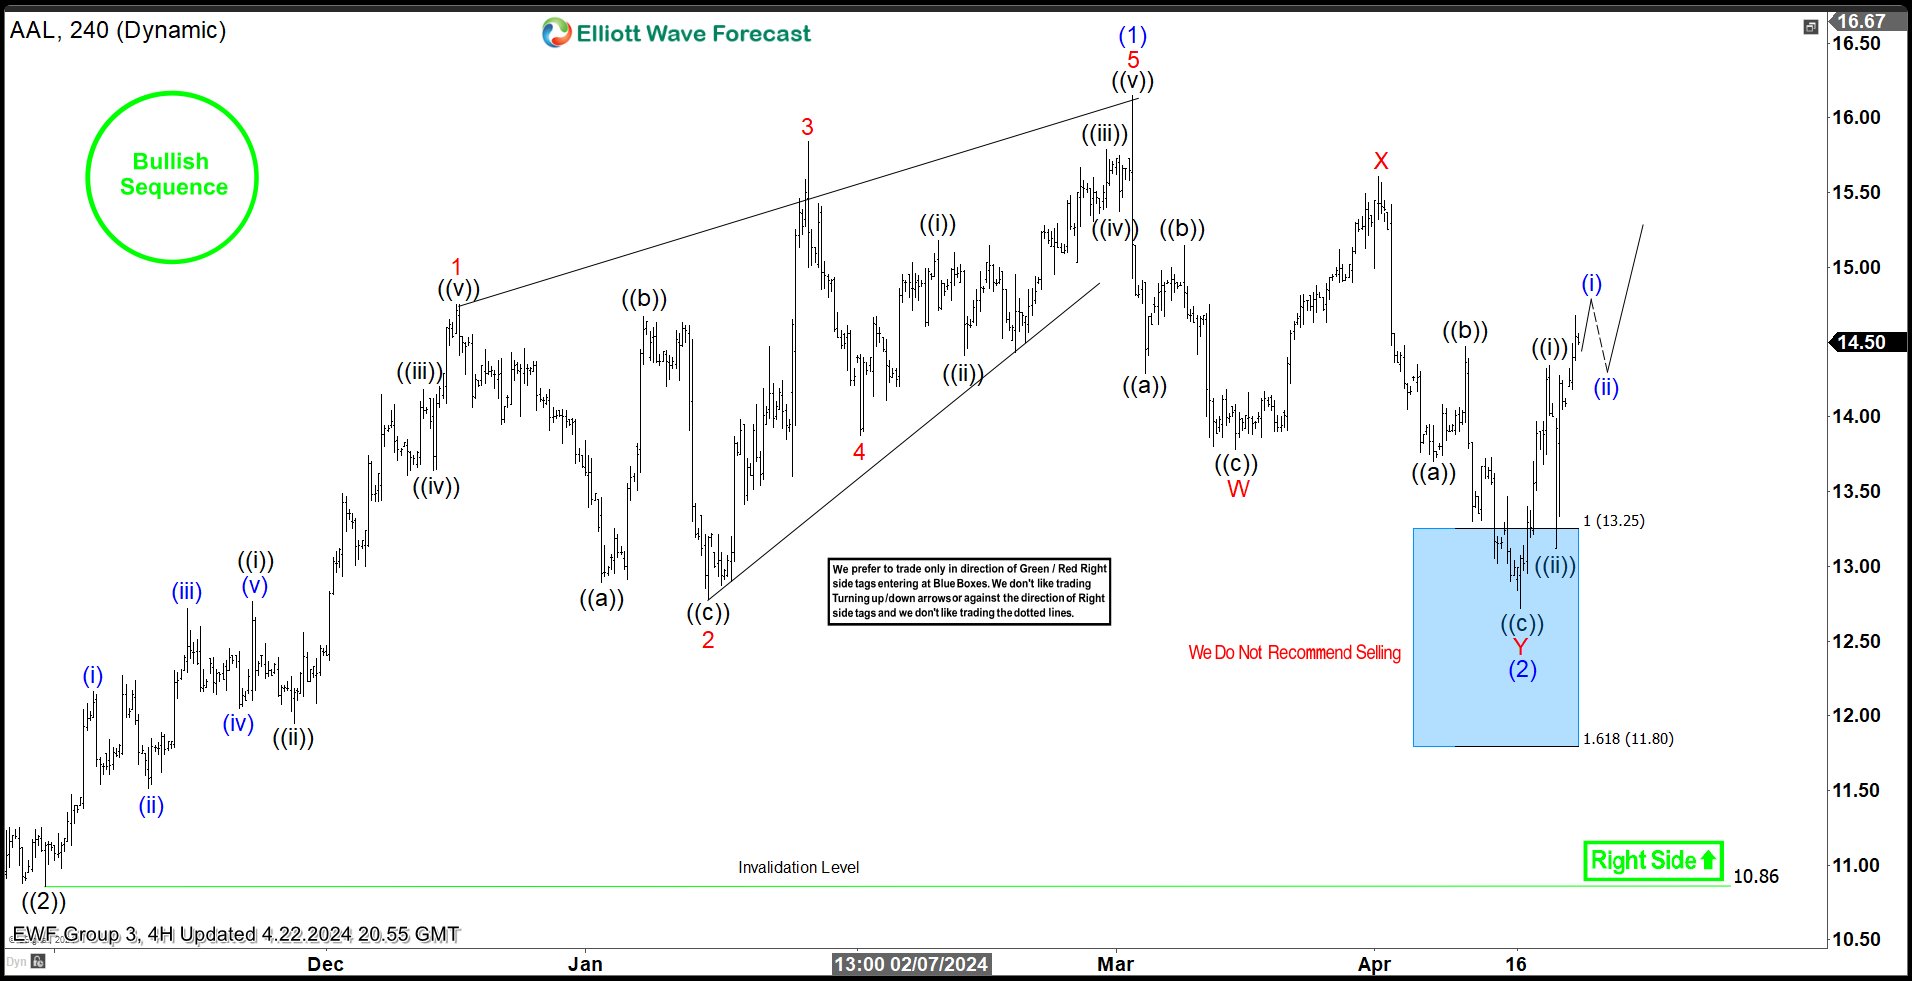
AAL Elliott Wave 4 Hour Asia Chart 04.22.2024
The stock has found buyers as expected and is showing a decent bounce from the Buying Zone which has reached and exceeded 50 fibs against the X red connector. We count the pullback (2) blue as completed at the 12.72 low. Consequently, long positions should now be risk-free. We’ve set our stop loss at breakeven and have already secured partial profits. Now, we would like to see a break of the (1) blue peak to confirm that the next leg up is in progress.
Keep in mind that market is dynamic and presented view could have changed in the mean time. You can check most recent charts with target levels in the membership area of the site. Best instruments to trade are those having incomplete bullish or bearish swings sequences. We put them in Sequence Report and best among them are shown in the Live Trading Room
New to Elliott Wave ? Check out our Free Elliott Wave Educational Web Page and download our Free Elliott Wave Book.
Source: https://elliottwave-forecast.com/stock-market/american-airlines-aal-stock-blue-box/
On the date of publication, Elliott Wave Forecast did not have (either directly or indirectly) positions in any of the securities mentioned in this article. All information and data in this article is solely for informational purposes. For more information please view the Barchart Disclosure Policy here.